Infograph Overview
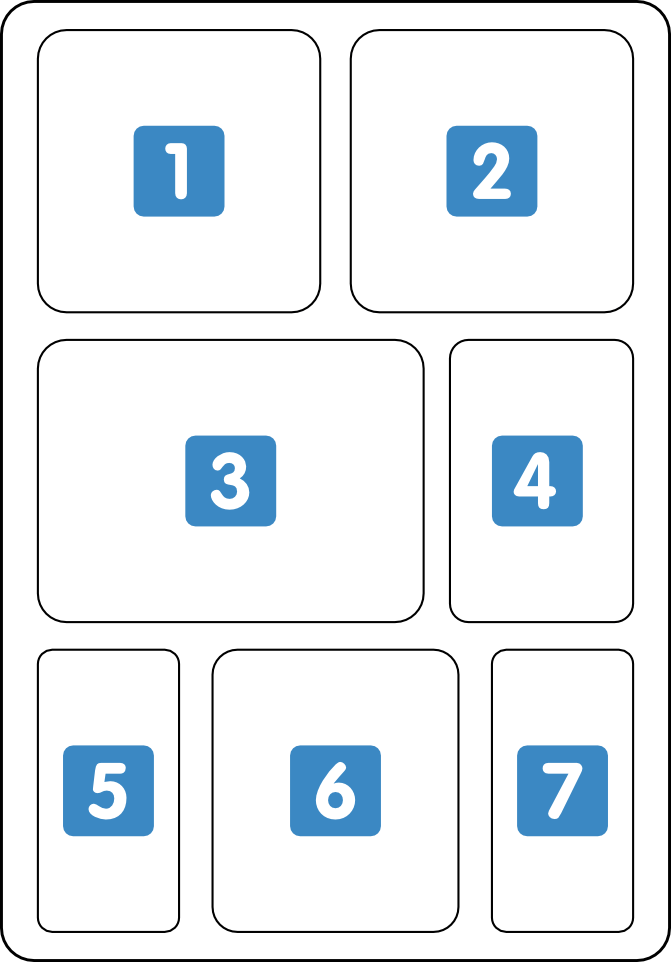
Octopus Watch has a powerful infograph on the electricity report to provide you with a wide range of new information to help you understand your usage and make meaningful changes. Each of the 7 panels (as shown below) is explained on this wiki page.
Reports are an advanced feature that is only available to subscription users.
 Electricity Usage/Import
This chart shows how your electricity usage/import evolved throughout the reporting period. The chart highlights your start and end values, as well as the highest/lowest values (these may coincide with the start or end value). Underneath the chart you can see the analysis as to whether your usage is stable, going up, or going down.
If you are on Agile …
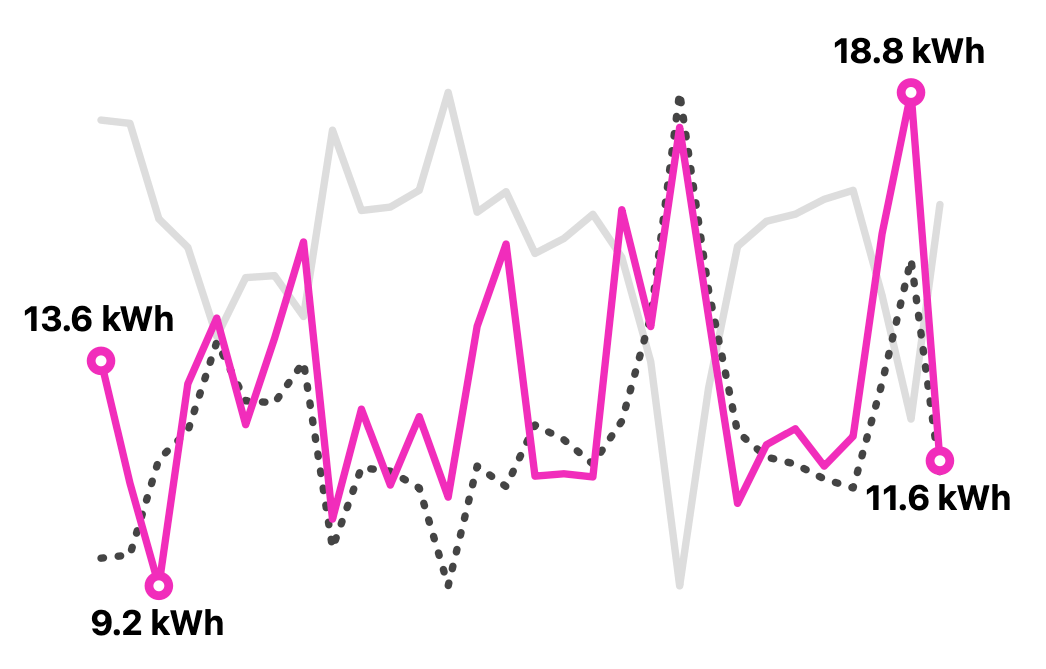 If you are on Agile there are two additional line charts. The best strategy on Agile is to use most electricity on cheap days, and less electricity on more expensive days. A solid light grey line shows you the Agile prices for the reporting period. A second dotted darker grey line is the mirror image of the solid grey line. The closer the dotted line matches with your usage/import, the more closely you follow the optimal strategy.
The report will explain below the graph whether you are:
- closely following 👍👍
- somewhat following 👍
- not following
- going against 👎👎
- going strongly against 👎👎👎
the Agile prices.
If you are not on Agile …
If you are not on Agile you only see your usage/import in the chart. You can find your daily average usage below the chart.
 Base Load or Export
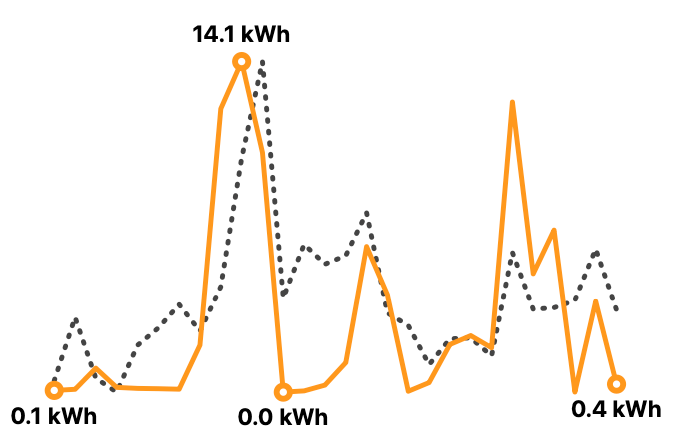
This chart shows you how your base load evolves throughout the reporting period, or – if you have export – shows how your export evolves.

If you have export …
If you have export the chart is the same as :one: but for your export data. You will not have a dotted line when you are on Agile export as this time the best strategy is to export the most electricity when prices are high.
 Daily Usage
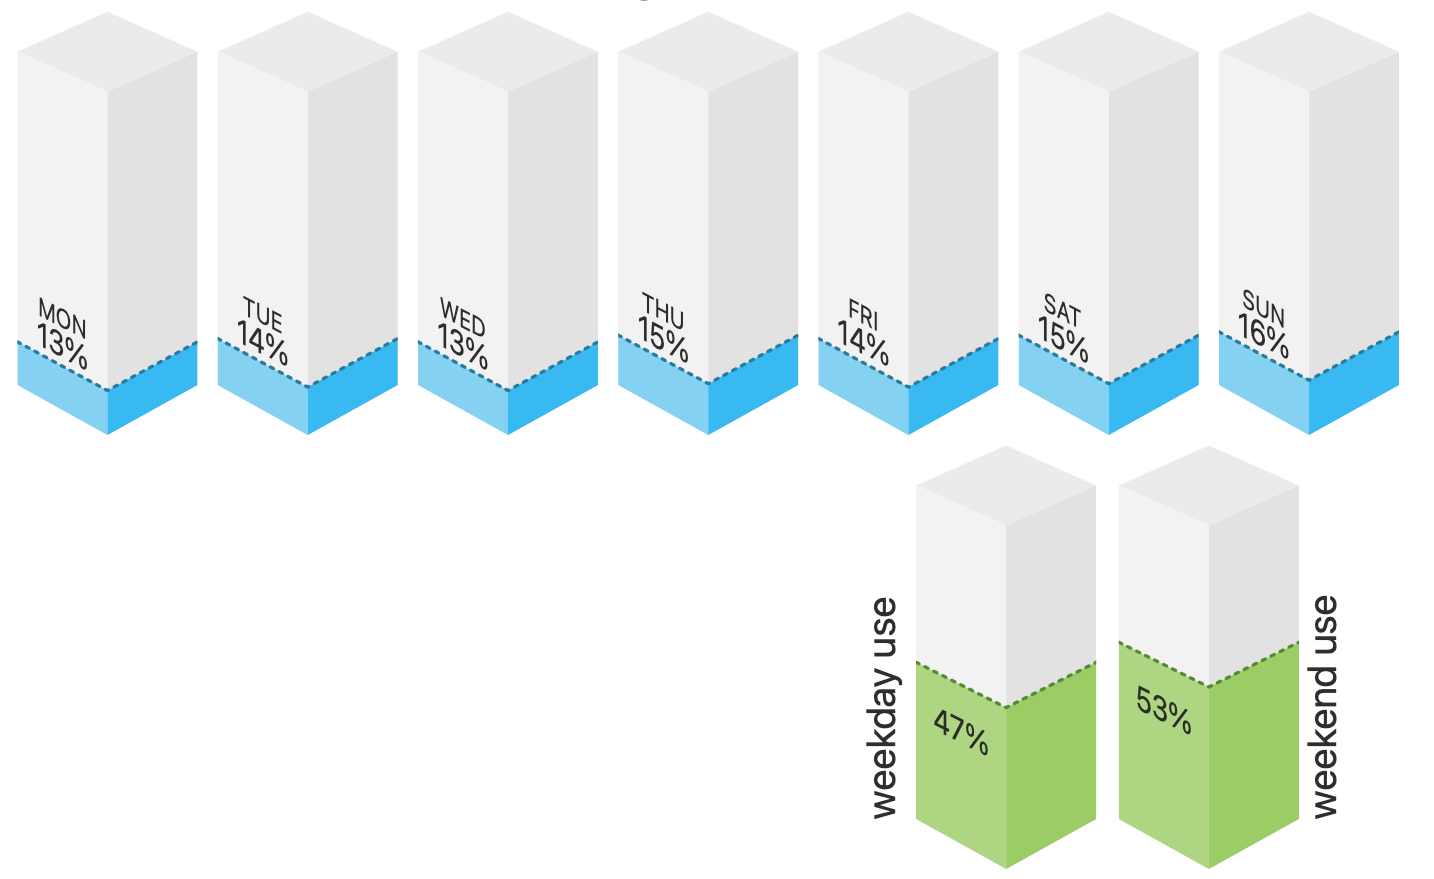
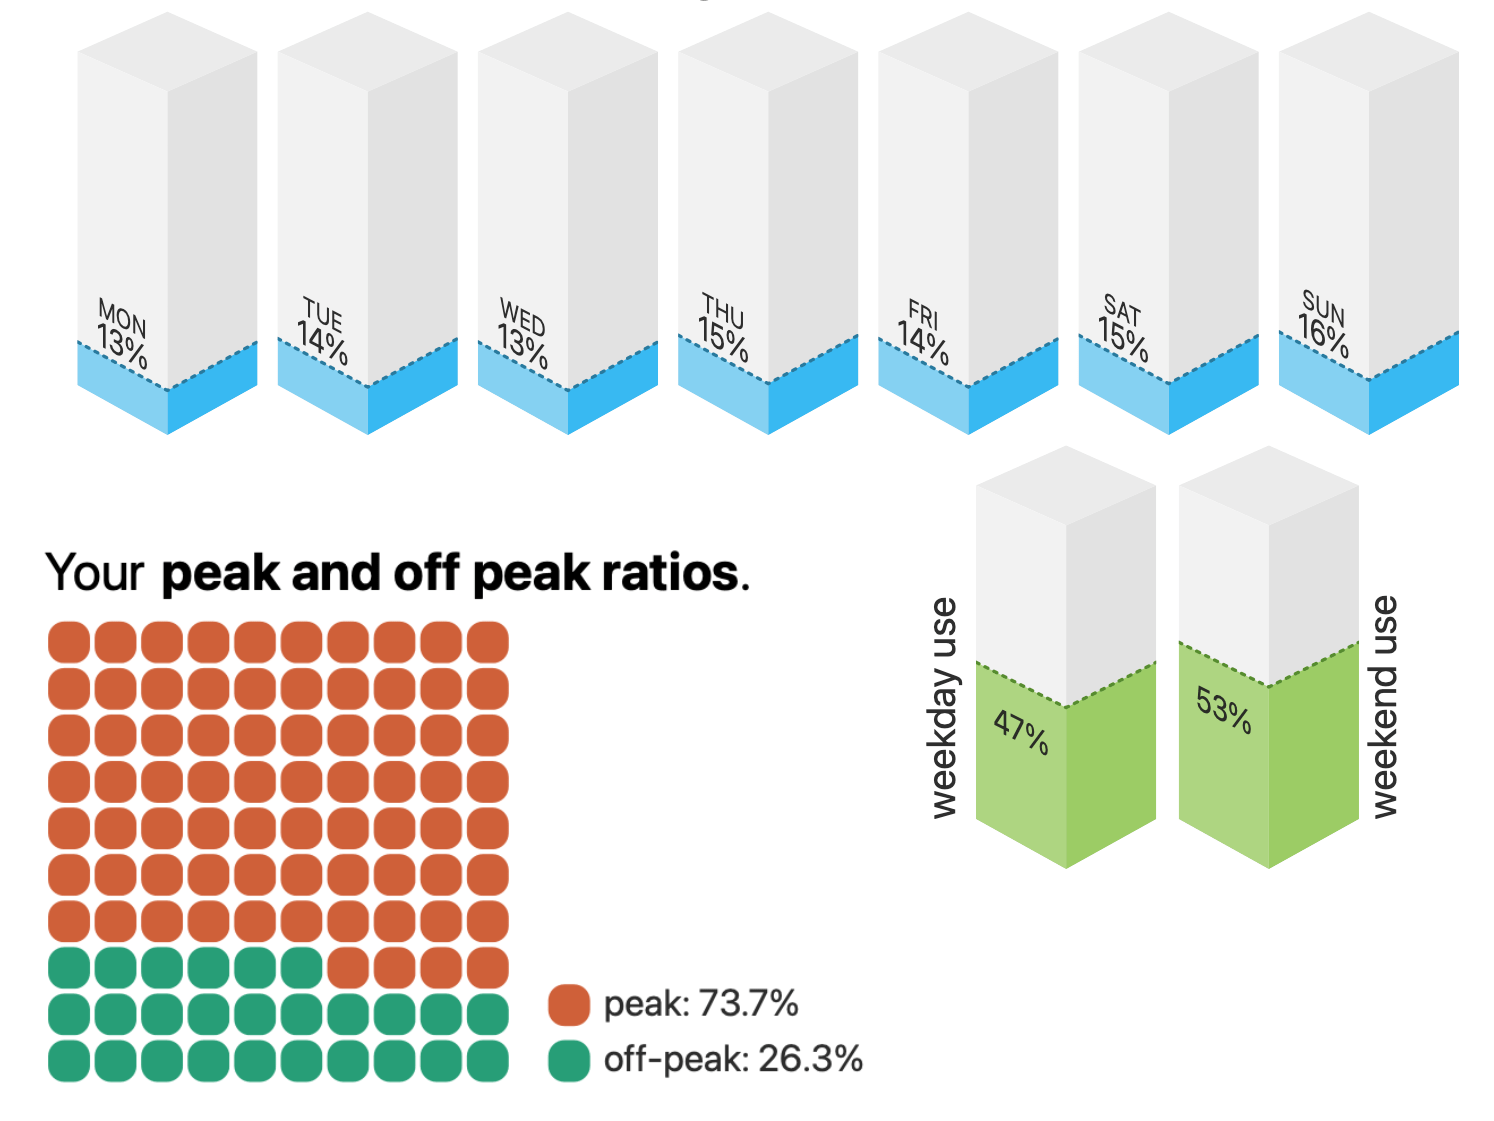
Some users have consumption patterns that vary wildly throughout the week. For example, a two-person household where both are going out to work during the week is likely to see a much higher use throughout the weekend. This graph helps you understand these patterns by grouping your usage both by each day of the week, and by weekday vs. weekend. The top shows your usage as a percentage for each day of the week. The bottom row is a weighted average of your weekday vs. weekend usage that takes into account that the weekend is only 2 days, while the weekdays are 5 days to more accurately compare weekday vs weekend usage.
If you have a dual or triple rate tariff, the analysis also provides information on how much of your energy was used on each rate. If you are on Agile, the report considers the usage between 4–7PM to be onpeak and any other usage to be offpeak.
 Load Shifting
You can help save the planet simply by changing when you use electricity. Octopus Watch already helps you achieve this by giving the option to find the slot with the lowest carbon emissions. Now you can see the impact of your actions. This chart compares your carbon emissions to the average carbon emissions for the chosen time period on the national grid. Can you beat the average full-grown tree? The tree crown fills up to show how well you are doing compared to how much CO2 a tree would absorb over the same time period.
Agile user? You have a clear advantage! Lower Agile prices often correspond with periods with lower carbon emissions.
Do you have export? Only import is looked at to determine your load shifting. Those with batteries tend to be able to greatly offset their CO2 impact. If you only have solar panels you are vastly more likely to import electricity at high carbon impact times.

 High and Lows
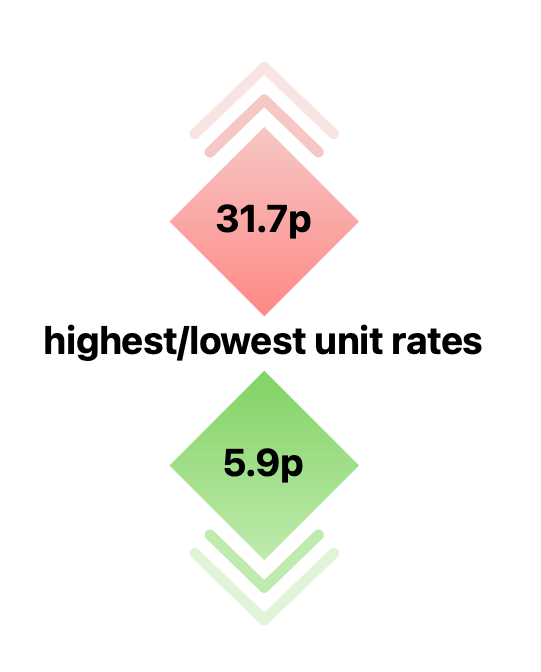
Some of us are on fixed tariffs, while others are on highly variable tariffs. Get a quick look at the lowest and highest prices during the reporting period.
 Net Use and Import Fuel Sources
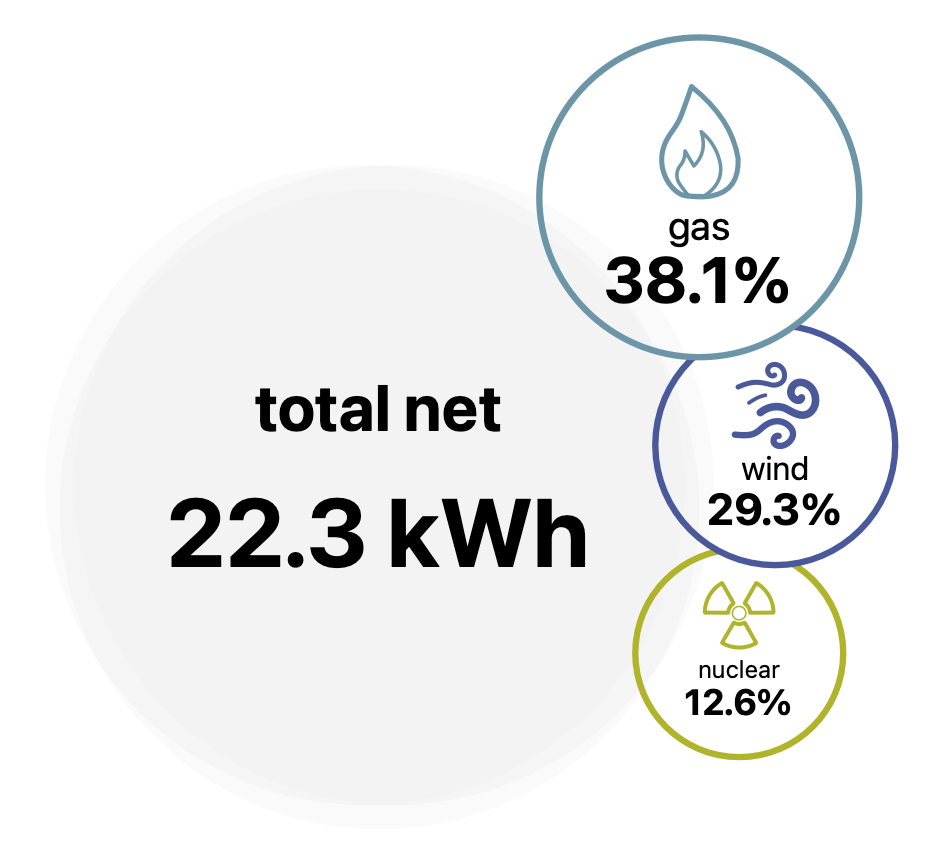
Here you can see the net kWh you used or put back on the grid. If you only have import this matches your kWh usage. If you also have export it is your import minus your export.
If the CO2 information is available this graph also shows you the main fuel sources of your electricity usage. This information only looks at your import, and – based on your preferences in the app – shows you either the national or regional fuel usage.
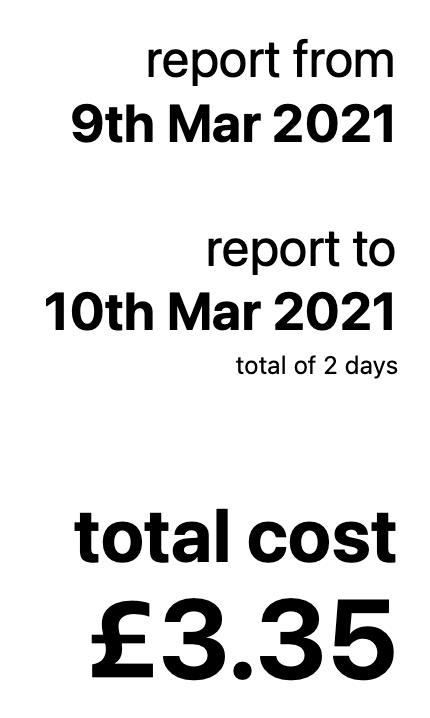
 Cost and Dates
To conclude, each infographic makes it easy to quickly see the reporting period and the total cost for this period.