Gas Infograph Overview
Fully understand your year-over-year gas usage with the gas infograph. This page explains the contents of the infographic in detail to help you make the most of it.
Reports are an advanced feature that is only available to subscription users.
Octopus Watch needs a full year of gas data to create your gas report. That’s because gas usage is seasonal (up in winter, down in summer). Octopus Watch can correct for minor gaps, but won’t let you create a gas report if the gaps span too many days, or when more than a month of data is missing. Octopus Watch won’t estimate the values for missing data. Always check the report to see how many days are included.

 Full year* Cost/Usage
Understand how much gas you used in a full year, either in pounds, kWh, or in equivalent carbon emissions.
The total number of days used for a report is a multiple of 7. This guarantees that box  isn’t skewed.
 Usage versus Weather
See how weather throughout the year is affecting your gas usage. The full orange/bright line is the average daily temperature. The grey/dark line is your gas usage. That same grey/dark line is flipped upside down as a dotted line to make it easier to see how gas usage goes up and down with temperature. The report also shows your base usage – for most households this is the gas usage for your hot water needs – and whether your gas usage is stable, or going up/down.
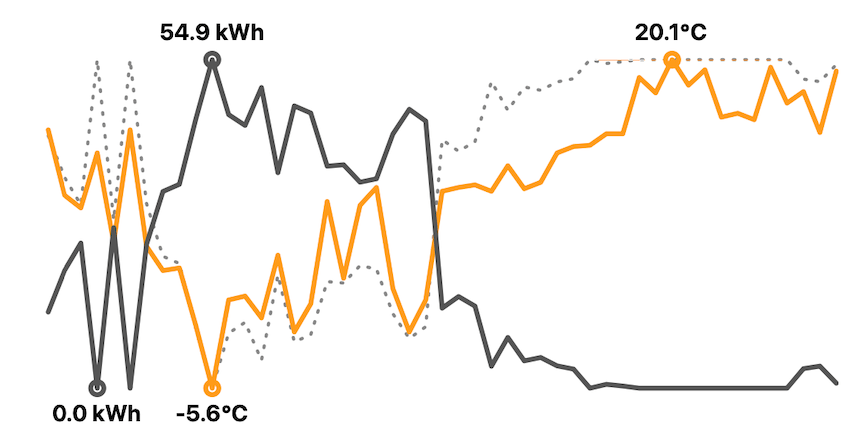
Plotting a full year of data would create a chart that is too busy to be useful. Instead, the app creates a chart that shows the main features. All the highs and lows are shown. If your usage is low throughout summer, as in the example, the chart shows 0 kWh to help you see that there are days where you didn’t use any gas at all.
 Quarterly Usage
Do you want to know how well you did each quarter, and compare it with the Ofgem price cap? For each quarter that falls (partially) within the report a box is shown for that quarter. The left and right-most quarter may also have a grey background. If the background is fully grey, then almost no days fall in this quarter. If the box is almost fully white, then almost all days of this quarter are used in the report. For each (partial) quarter you can see both your total usage and the average unit price you paid.
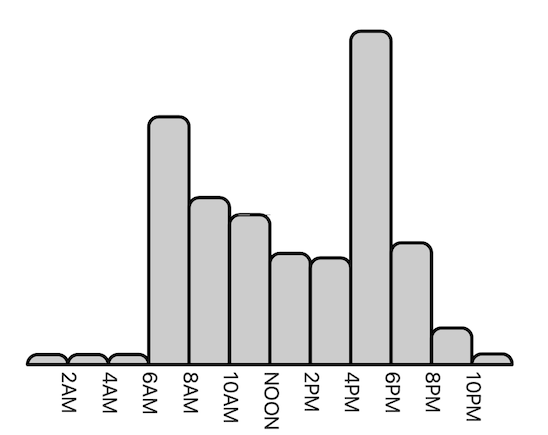
 Usage by Hour
Many households don’t have their gas boiler on all the time. Instead, they set a thermostat to kick in when they are home. Doing so can help you save a lot on your heating bill. Use this chart to make sure that you only use the gas boiler when someone is home and awake.
Usage by Day
If everyone in the household is out of the house during the day, you may want to consider lowering the temperature during the weekdays. This chart uses modified scaling to show you how much gas you use on each day of the week, and how days compare to each other. If you see a lot of gas usage on days where everyone is out of the house, you may want to consider lowering the temperature a bit on those days to help you save on that heating bill.
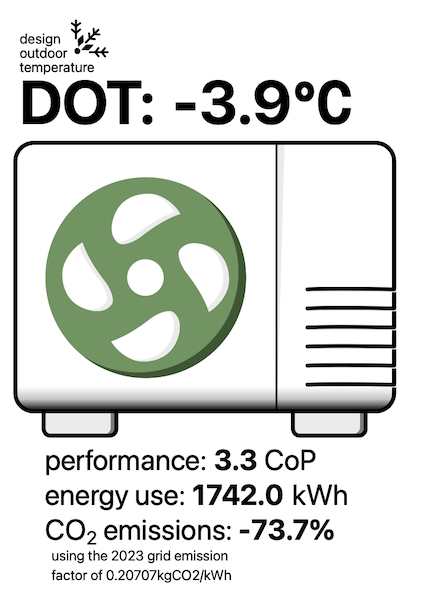
 Heat Pump Switch
Ready for a heat pump? To help you with the correct sizing the report uses its extensive weather data to determine your DOT – Design Outdoor Temperature. This DOT is specific to your location and altitude.
In addition, Octopus Watch can calculate the performance of your future heat pump, and you might be surprised by how well it performs. The report shows you the expected seasonal performance, based on when you use heating and the weather for your area. The data is based on the results discussed in the paper Coming in from the cold: Heat pump efficiency at low temperatures from Oxford University and the Regulatory Assistance Project (RAP) think tank. This gives you a realistic idea of a heat pump efficiency for your property, the expected energy use, and the expected reduction in carbon emissions (based on official estimates from the Department for Energy Security and Net Zero).
 Save Now
Not ready for a heat pump? There are measures you can take right now that can help you reduce gas usage significantly. Obviously insulation is one them, but did you think of the following three?
Only Heat Rooms You Use
Different rooms in your home are used at different times of the day/week. Why are you heating the bedroom during the day? And if you are working from home, why are you heating the unused living room when you’re sitting in your study? Smart thermostats are an easy replacement for dumb thermostats on your radiators. The old thermostats simply unscrew – no water, no plumbing! The new thermostats can be programmed for a daily or weekly schedule, and some can even react to temperature changes from an external thermometer. Basic models cost £150 for a three bedroom house, but can help you save 10–20%. Smart thermostats with external thermometers cost £500 for a three bedroom house, but can help you save up to 40%.
Reduce Heating Temperature
In Britain we like our homes warm during the winter. But did you know that you save on average 7% on your heating bill by lowering the temperature by just 1°C? The gas report analyses your usage and calculates how much you would save when you drop your temperature by 1°C and 2°C. For the elderly and the very young, a home should be heated to 20°C. For the healthy, the temperature should be 18°C or more. Compensate for the lower temperature by dressing well. Wear multiple layers and a sweater throughout the winter, and wrap yourself in a warm (heated) blanket when you cuddle up in the sofa.
Of course, in the UK we have to be wary of humidity. Optimal humidity is between 40–60%RH. As the temperature in the room drops, the relative humidity goes up. That’s why the weather integration shows you the outdoor humidity relative to your indoor temperature. Airing your house frequently – even during the winter! – is important to maintain a healthy indoor climate. A lower indoor relative humidity also means your heating doesn’t have to work as hard to heat up the moisture in the air. By airing your home frequently, you actually save on your heating bill.
Reduce Boiler Flow Temperature
Modern gas boilers are condensing gas boilers. These boilers are more efficient than older boilers, but only when they operate at low temperatures. That’s because they use the warm gas condensate to pre-heat the cold water that was used to heat your home and is flowing back into the boiler. The colder this water is, the more efficient the boiler is. When the temperature of the water that comes back exceeds 55°C the boiler cannot condense and only works at ~85% efficiency. When the return temperature is 30°C, that efficiency increases to ~98%. Running your boiler too hot can end up costing you ~15% more.
If your boiler has a temperature compensation control it reduces flow temperature automatically for you. If you don’t have it you can install it on most condensing boilers for ~£50, though having it installed costs extra. You can also do it manually. Check your boiler every month and reduce its heating temperature to a level that is low enough while remaining comfortable. That means it can heat up your rooms suffciently quickly in the morning. When your boiler heating temperature is set to less than 55°C, it will always condense and run more efficiently.
Radiator balancing and bigger radiators are two other ways to reduce your boiler flow temperature. Radiator balancing is a process where you make sure that all radiators in your home heat up at the same rate. This means that you can lower the boiler flow temperature, and still have a warm home. Bigger radiators can also help you lower the boiler flow temperature. Radiators come in different types of thickness, where a type 33 can heat up your home at much lower boiler flow temperature than a type 11 because it has a heat capacity of almost six times as much. Particularly if your home has type 11 radiators, swapping them for type 22 can be an economical choice. While type 33 is definitely (a lot) more expensive, you may consider these if you plan to upgrade to a heat pump in the near future. A competent DIY person can replace a radiator in a few hours, and a plumber can do it in less than an hour – for a fee.
If you have a water reservoir, you should make sure that the temperature for the hot water is always set to 50°C or higher. These water temperatures are needed to make sure that legionella bacteria cannot grow. If you have a combi-boiler this warning doesn’t apply to you as water is only heated as needed.
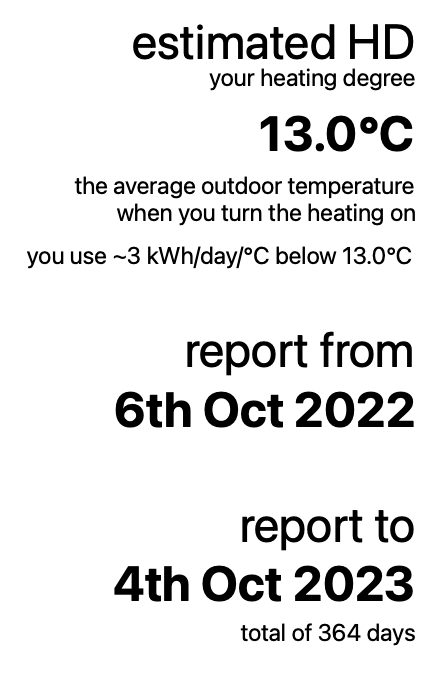
 Heating Degree and Dates
The gas infographic creates a report for you for the last year of known gas data. You can see the included dates in this section. In addition, the report calculates your heating degrees. This is the average outdoor temperature at which you turn on the heating. A lower value here is better, and indicates you don’t heat your house as warm as others, your house has better insulation, or both! Here you also find your estimated kWh/day/°C. This is the amount of gas you use per day per degree Celsius below your heating degree. For example, if this value is 3 kWh/day/°C, your heating degree is 13°C, and the average outdoor temperature is 10°C, then you use about this much kWh that day: $$ \begin{align} (13\textit{°C} - 10\textit{°C}) \cdot 3\textit{ kWh/°C/day} & = 3 \cdot 3 \textit{ kWh/day} \\&= 9 \textit{ kWh/day} \end{align} $$