Predictions

Start planning ahead with Octopus Watch’s predictions. Instantly see the forecasted rates in the app, helping you save money by timing your energy usage perfectly. Predictions are integrated into the app and are both easy to see and easy to understand.
Predictions are an advanced feature that is only available to subscription users.
The brand-new Nix 5.0 prediction engine launched on 1st June 2025, delivering more accurate predictions. There is nothing you have to do; you will automatically get the improved predictions in the app.
Your Guide to Smarter Planning
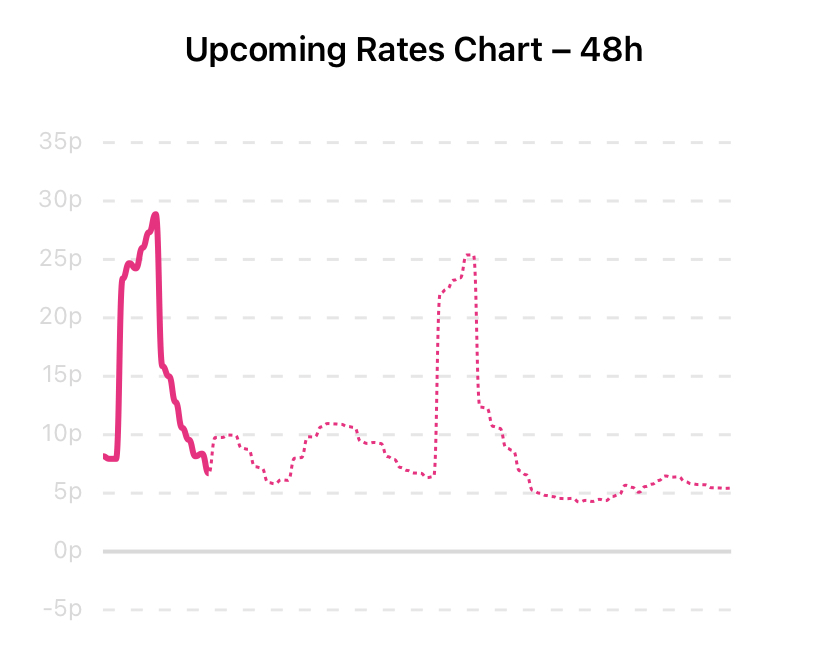
The chart with the dotted line can be used as-is for a quick indicator of future prices. Yet a little knowledge goes a long way to better use these predictions to benefit you:
- 3–7 days ahead
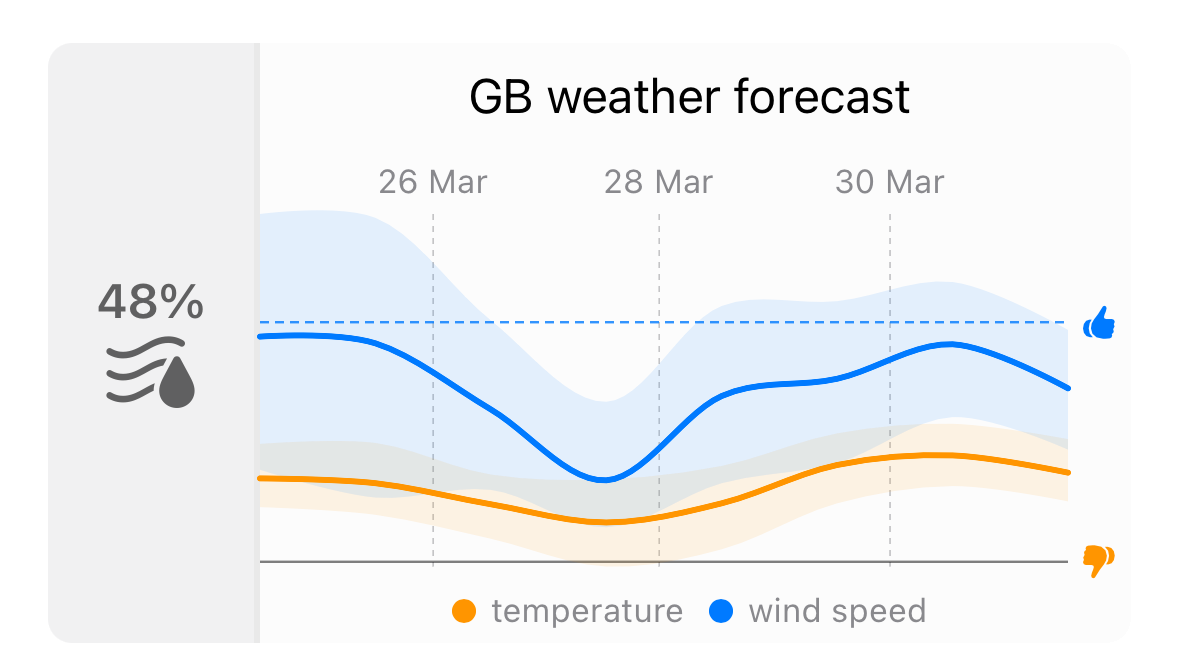
- Use the weather chart (enabled in Settings → Options) to spot money-saving opportunities before they happen. The weather chart shows wind speeds (blue) and temperatures (orange) across Great-Britain. The thin line is the average, and the shaded area is a confidence band — the highs and lows across Great-Britain. If blue (wind) goes above the thumbs up line there is a lot of wind and rates tend to be low. If orange (temperature) goes above (too hot) or below either of the lines rates tend to be higher.
- from 48h in advance
- Half-hourly predictions kick in, giving you more detailed insights. While these can shift like any weather forecast, they’re perfect for getting a feel for what’s coming. The app shows 24-hour predictions by default - just enough detail without overwhelming you. If you want 48h predictions you can enable them in Settings → Options. For accuracy the slot finder only uses the next 24h to find the best slot, even if you enable the option “Use Predictions”.
- the day before, from 9-11AM
- More and more balancing information for the National Grid becomes available through BMRS. This allows very accurate predictions that are often close to the actual rates.
- the day before, from 4PM
- All balancing data is available and rates are estimated highly accurately. Next day values are typically loaded into the app by 3:55PM. The app, thanks to its predictions, can show you next day rates even if the rates do not become available through Octopus Energy at 4PM.
Meet Nix
Nix, the prediction engine, is now in its 5th iteration. This sophisticated tool uses a huge collection of data to predict upcoming prices. It’s like having an energy expert at hand with information on the most likely rates to come.
- Smarter than Ever
- Nix 5 uses 13 specialized models (up from just 4) to make the best predictions at any time of the day. Each model has its own strength; some are great for long-term trends, others get very accurate next-day rates. There are still 4 groups of models. Long term models make predictions for rates of 24–102h ahead of time, medium term models predict up to 24h in advance, high accuracy models predict 8h in advance, and next-day models predict 0h in advance. The 0h models make sure you know the rates for the next-day, even when Octopus Energy doesn’t announce the next-day rates at 4PM.
- and Getting Smarter
- When the grid runs on clean energy, Nix uses that time to get even smarter. It’s constantly learning from new data, adapting to market changes, and teaching itself which information matters most.
- Nix Predicts 4 Days
- While you only see 2 days of predictions, Nix actually forecasts up to 4 days ahead with high accuracy. This means your predictions stay stable even during internet hiccups or system maintenance - no more gaps in your planning. And future app updates will use these extra predictions to keep you informed about upcoming price changes in novel ways.
- Nix Predicts Wholesale Prices
- Nix doesn’t just predict Agile prices. This makes Nix applicable to Agile or Tracker, and makes it easy to adjust to sudden rate changes – such as sudden discounts like the Energy Price Guarantee.
- Nix uses a Lot of Data
- Approximately 185 features/columns and ~110,000 points/rows are used for training. Nix can use weather forecasts, energy regulator information, and facts such as public holidays. With all that data each model takes a while to train: roughly 48h on a 10,000 CPU mark system.
How accurate are the predictions?
Nix gives its best estimate of future rates based on the data available. It uses a combination of weather forecasts, energy market data, and historical trends to make these predictions. However, like any prediction system, it has its limitations and uncertainties. Rather than boring you with statistics, here are two real examples showing Nix’s predictions overlaid with actual prices:
6 April 2025 – Nailed It
These are the predictions of model 0 (96h) and model 21 (24h) for 6th April 2025:
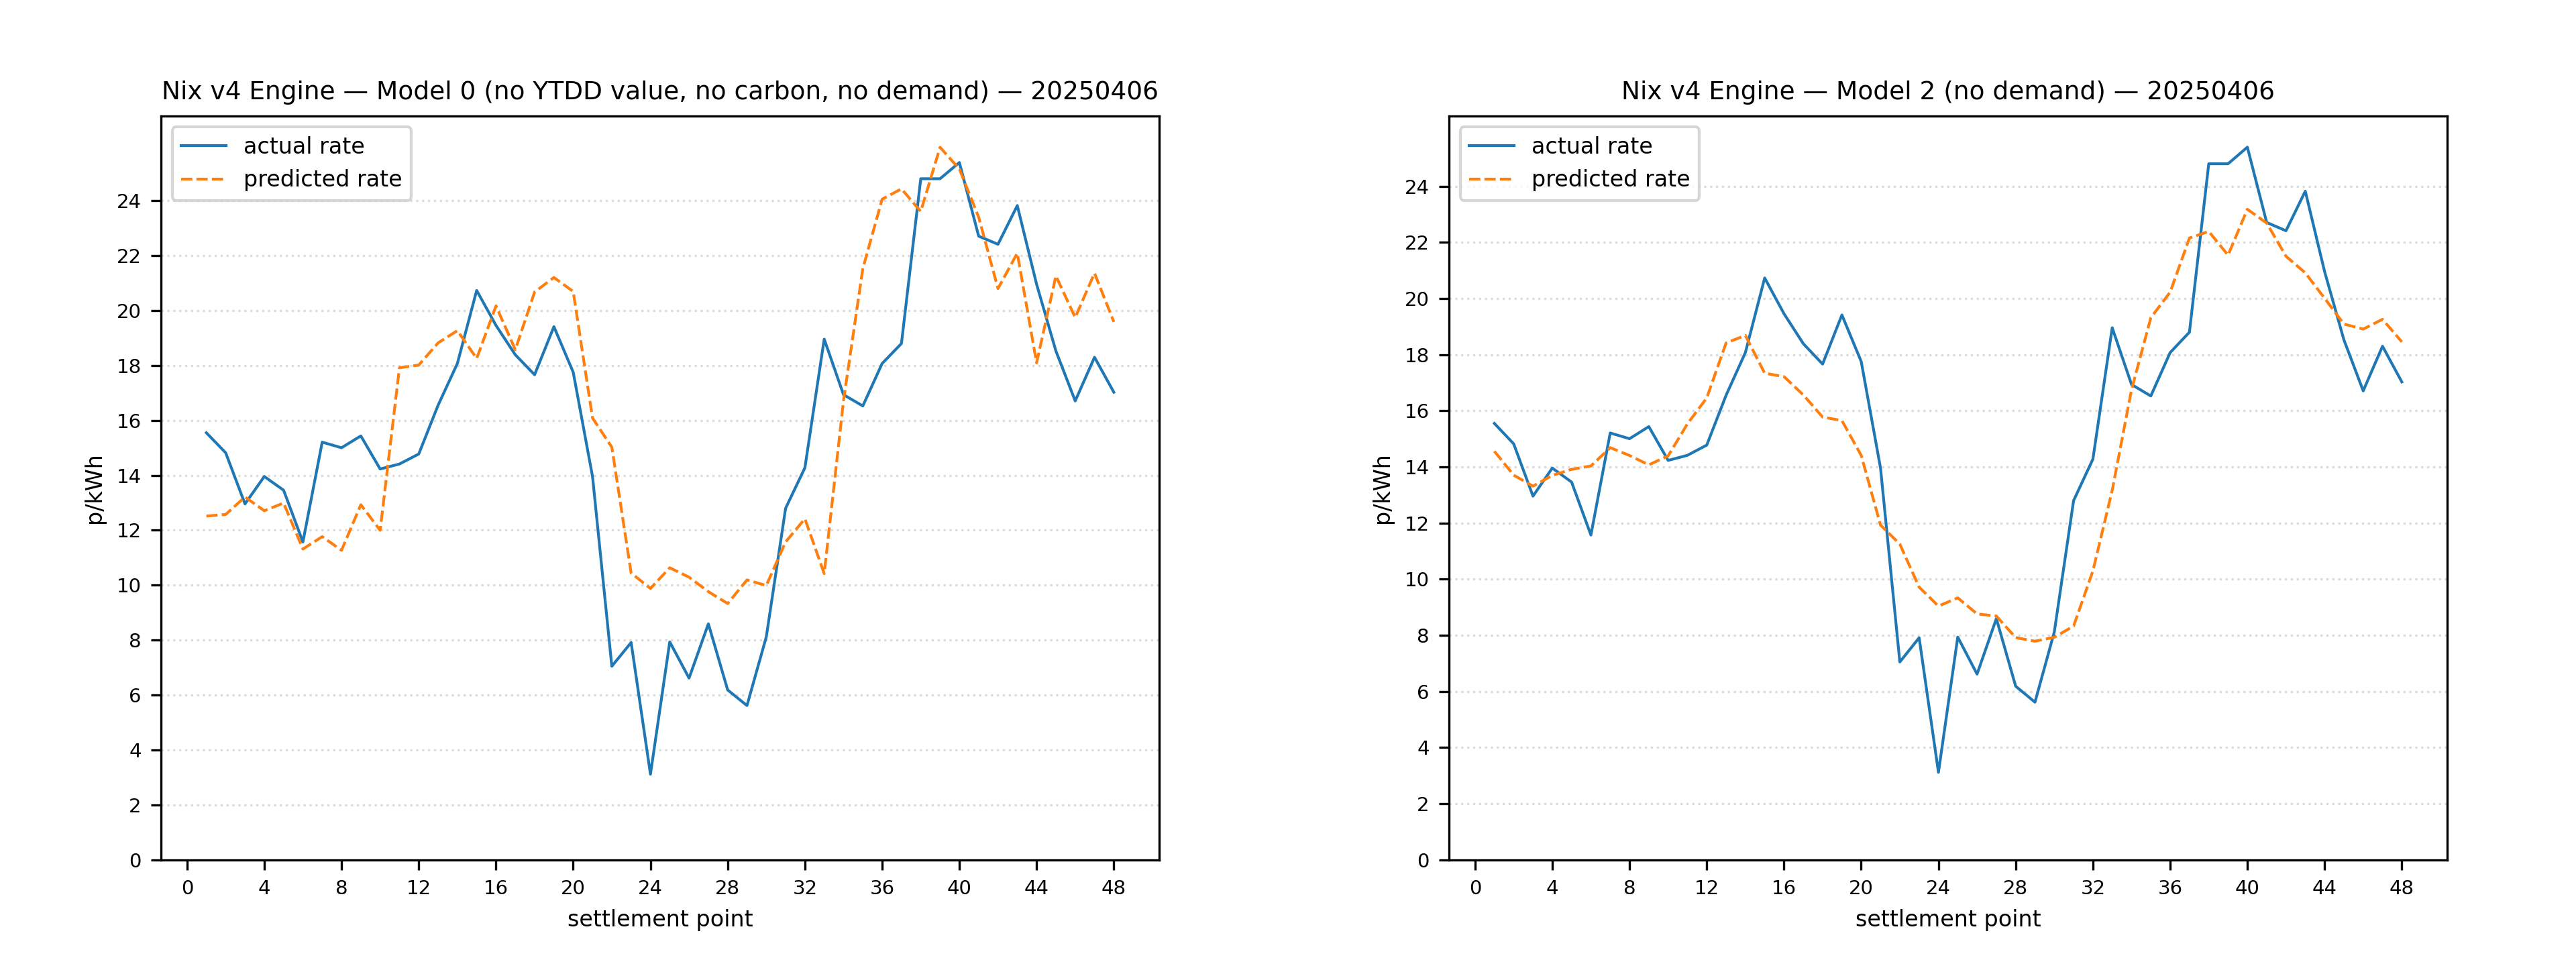 On average, even 4 days in advance, rates are predicted very well, giving accurate notice of an upcoming drop in rates.
12 April 2025 – Adapting to Challenges
These are the predictions of model 0 (96h) and model 21 (24h) for 12th April 2025:
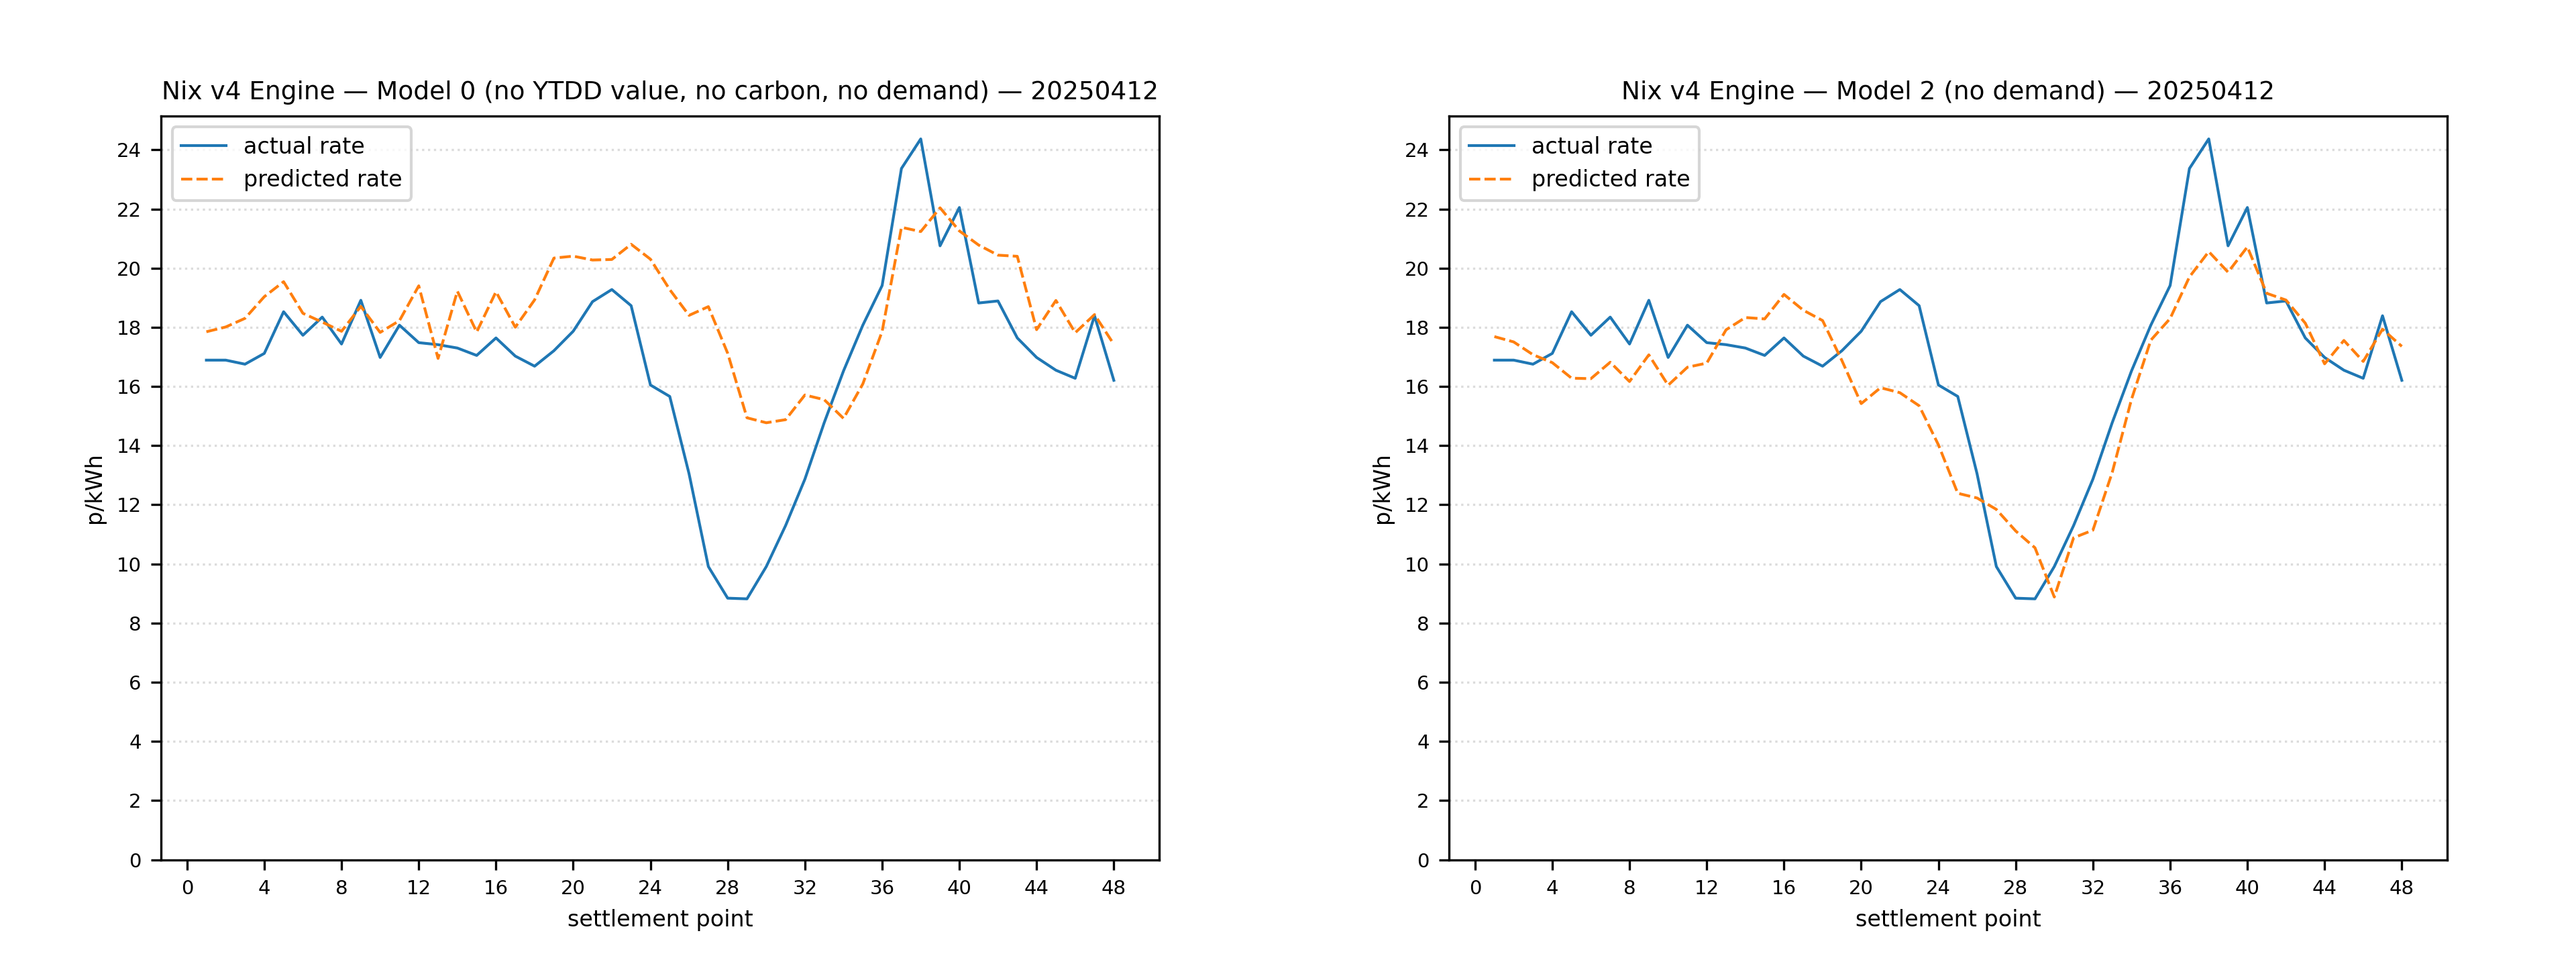 Weather was more unstable for this day, meaning the predictions 4 days in advance had a harder time forecasting a drop in prices. But the 24-hour model delivered high accuracy when it mattered most.
The bottom line: Nix gives you the best possible forecast with the data available, helping you make smarter energy decisions every single day.