Live - Home Mini
Octopus Watch can show the live data gathered from your Home Mini – along with additional functionality to help you better manage your usage. At the moment this is a subscription-only feature.
When the app detects a Home Mini two new options will appear in the Options screen. Please note that it can take up to 24h for a Home Mini to be detected.
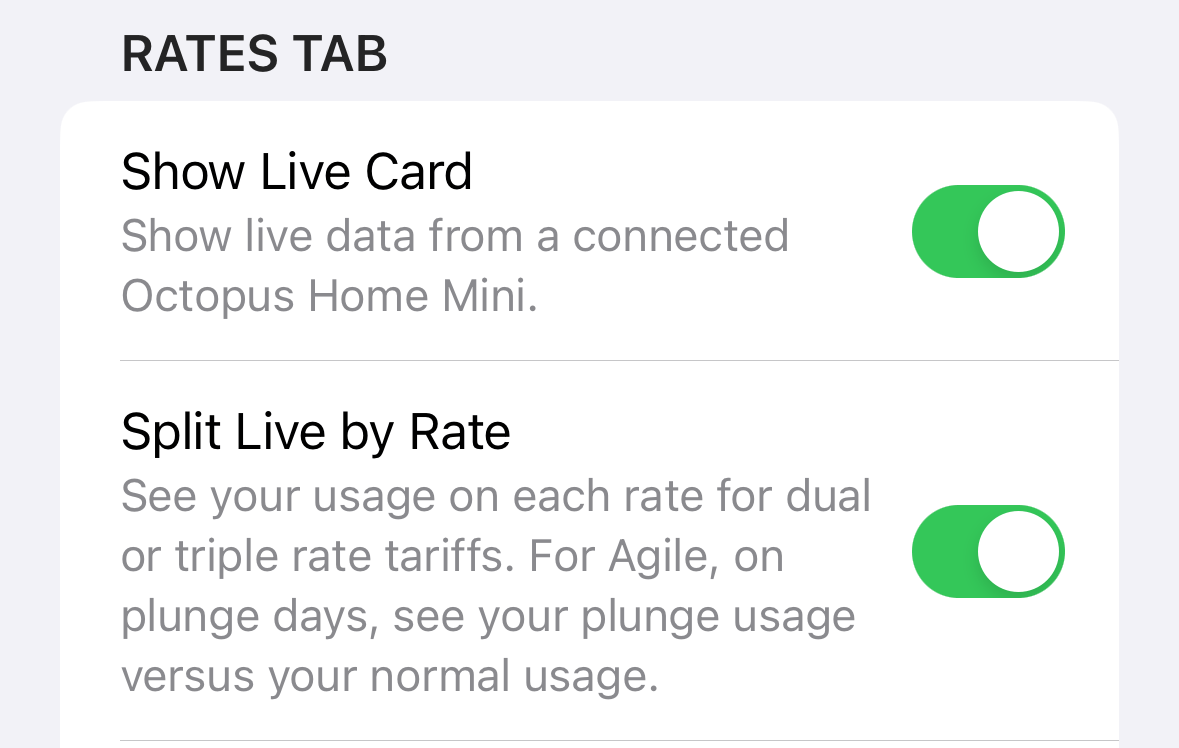
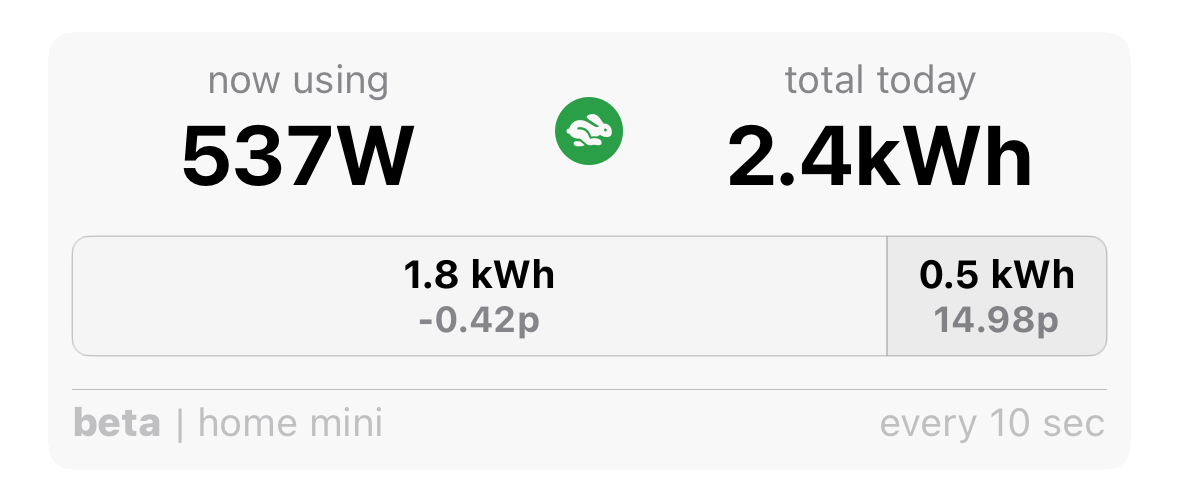
The first option enables the Live Card on the Rates tab. This card shows you  your current usage, and
  your total usage since midnight (UK time zone). When rates are not available or cannot be accessed the card shows “–” instead of actual values.
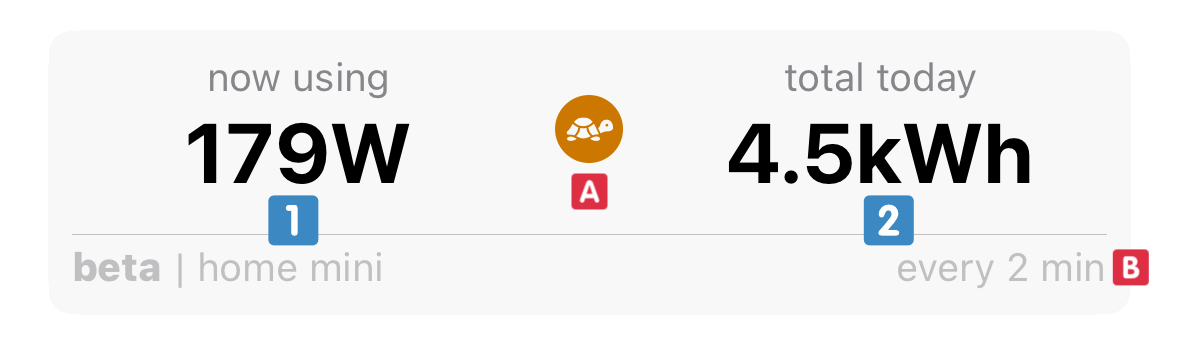
By default, Octopus Watch only updates your data every 2 minutes (see the limitations section below for an in-depth explanation). By tapping the tortoise icon  you can switch to fast mode. When in fast mode the app updates:
- every 10 seconds for the first 2.5 minutes;
- then every 15 seconds for the next 7.5 minutes;
- every minute for the next 20 minutes;
- every two minutes until the end of the hour.
At any time you can see the actual update speed in the bottom corner
 . Using fast mode is designed to give you quick – live – information, with little risk of hitting the limitations of the Home Mini. If you use other devices or integrations that use the Home Mini at the same time, then you may exceed the limitations of the Home Mini and the API. It is recommended to only use fast mode on one device, and only if you do not use other Home Mini integrations that continuously poll for data.
Additional Functionality
Octopus Watch makes it easy to see how much appliances use, track usage over time, track your usage on multi-rate tariffs, and keep on top of plunges on Agile.
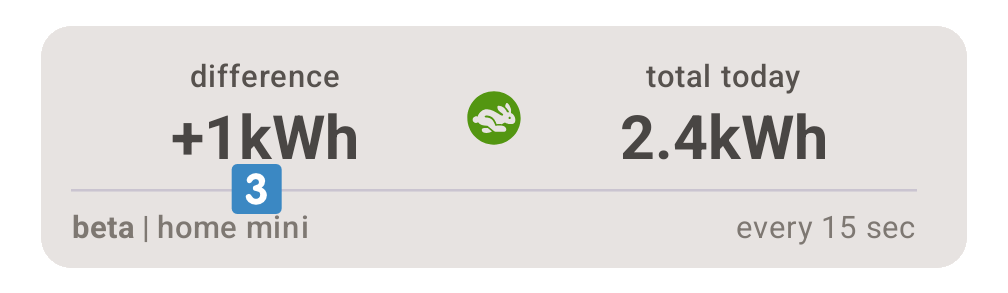
Long press on your current usage to see the differential. Your current usage is taken as the reference point, and the app tells you how your usage increases/decreases. Did you always wonder how much that espresso machine used? Long press on your usage and the app will tell you  . To exit this mode simply long press again. The app also exits this mode when you force close the app. This feature works best when you have enabled fast mode .
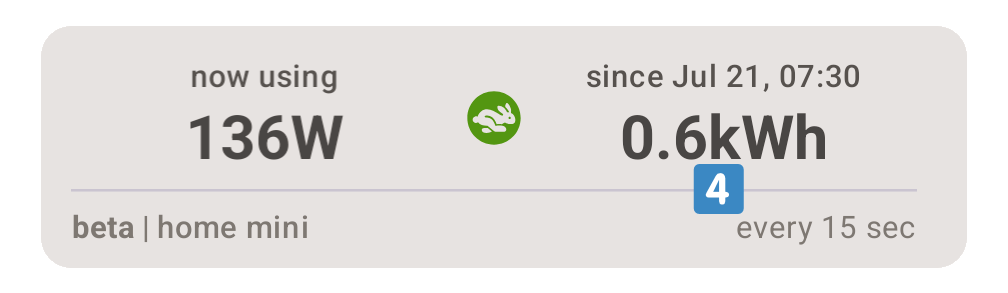
If you want to track total usage over time you can long press your daily total. The app starts tracking your extra usage from that time of the day  . To exit the tracking mode long press it again. This tracking continues even when the app is closed.
The app can also track your usage throughout the day per rate. This is only available if you are an import-only user. Enable the option “Split Live by Rate” to use this feature. Go, for example, has a low and a high rate, and Cosy has a low, medium, and high rate. If you are on Agile the bar is hidden by default, but will appear on plunge days to allow you to easily track your usage during the plunges versus your default usage throughout the day. In this case the rate that is shown is the weighted rate you achieved during plunge times versus the weighted rate you paid outside of plunge times.
Limitations
The API applies some very strict call limitations. What this means is that, for your account, only 100 calls can be made every hour. These 100 calls are for your account, so they are shared by all your devices and all your active integrations. Octopus Watch does its best to be a good player here. The live card only updates when the app is open, the Rates tab is shown, and the live card is visible. In practice this means that the app only uses a handful of the calls allowed by the 100 call limit. Even in fast mode the app only tends to use a couple dozen calls. Nevertheless, 100 calls is very little. Be wary of integrations such as in Home Assistant that have continuous polling. Be wary of using other apps – including the Octopus Energy app or website! – as they will quickly eat through your hourly limit.